How to measure market penetration at the last mile

By Chitraksh Sharma, Lucie Bévierre & Lucie Klarsfeld McGrath at Hystra
Should your last mile distribution company expand into new locations or increase penetration in existing ones? One way to answer this question is by measuring your market penetration. Here we explain how to calculate this KPI and, using benchmark values of last mile distributors, provide guidance on answering this strategic decision.
Know when to expand
The most difficult and costly sales are generally the first ones in a community because no one knows your company or products. So once you’ve got those first customers you should prioritise maximising sales in that same location before you expand into a new – and more costly – area.
Good marketers leverage early adopters to increase local penetration before moving to the next location.
The market penetration KPI measures whether your company has maximised penetration in its core geographic areas. If you haven’t, then it may be more cost effective to invest in generating sales where you operate now, rather than expand further afield.
How to calculate your market penetration

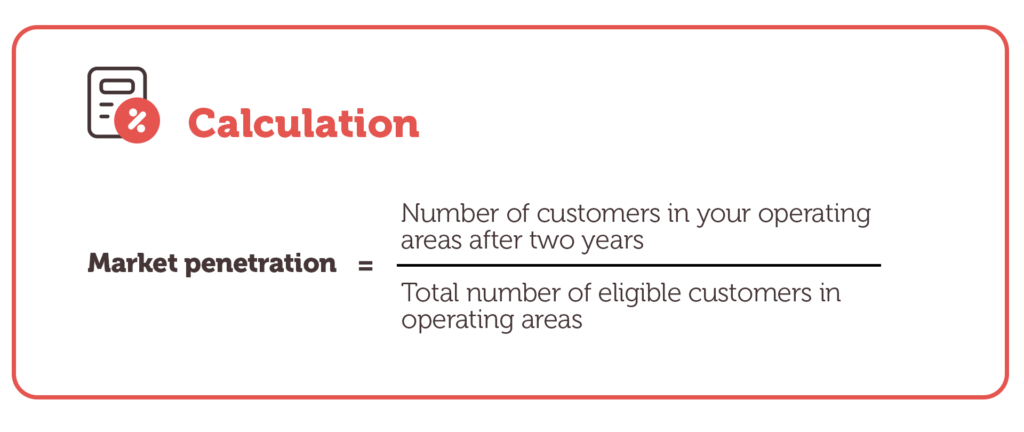
Use this calculation to measure your market penetration:
Market penetration = Number of customers in your operating areas after two years ÷ Total number of eligible customers in operating areas
This KPI should be measured quarterly.
Operating areas are specific geographic locations where your sales agents work (e.g. villages).
Eligible customers are those who fit within your target customer criteria.
Caveats and clarifications
This KPI is suitable for sales of durable goods but not for fast moving consumer goods (FMCG). It’s also less relevant in more mature markets where competitors might have captured some of the market, making high penetration harder to achieve for a single company.
Benchmark values
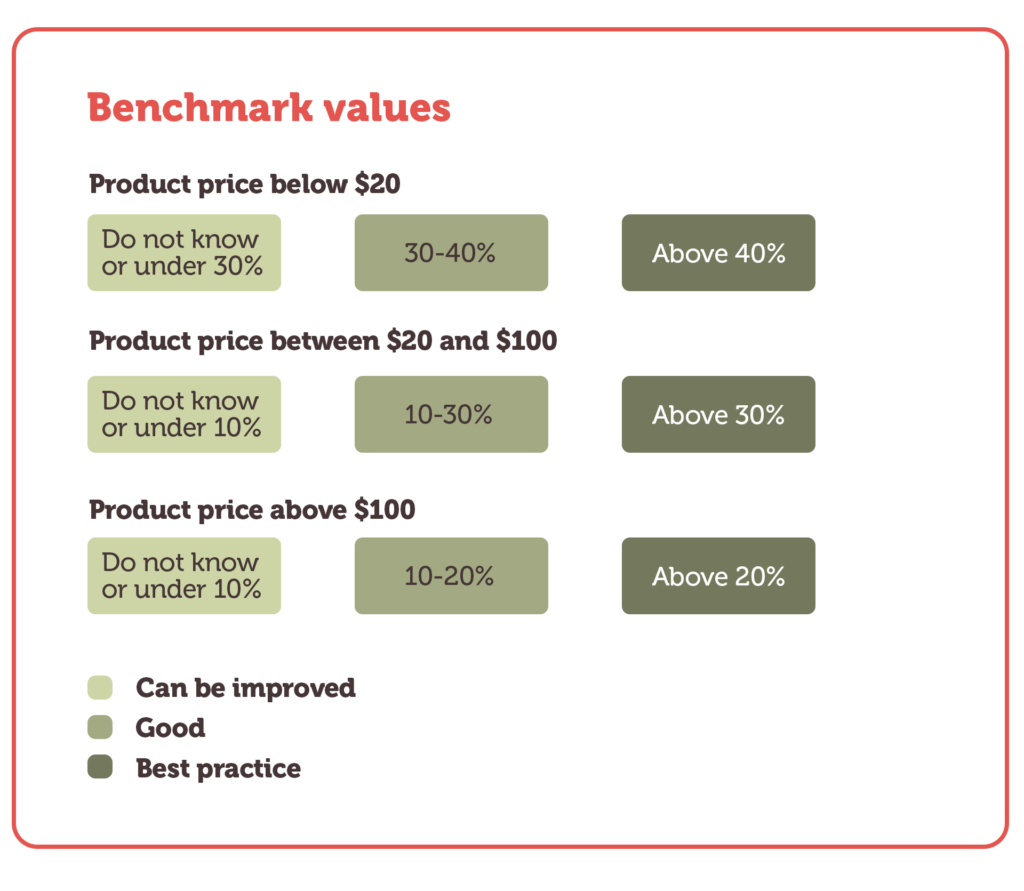
Benchmark values depend on the price of the product you sell:
Product price below $20
- Can be improved: Do not know or under 30%
- Good: 30-40%
- Best practice: Above 40%
Product price between $20 and $100
- Can be improved: Do not know or under 10%
- Good: 10-30%
- Best practice: Above 30%
Product price above $100
- Can be improved: Do not know or under 10%
- Good: 10-20%
- Best practice: Above 20%
Benchmark values for marketing penetration depend on the level of competition your company faces in a location. The benchmark values shown here are for areas where you face lower levels of competition, and so market penetration levels should be higher.

Best practice
Leverage existing customers
Existing customers can be incentivised to become lead generators and identify groups of potential customers. In some instances they may collect payments on behalf of sales agents. Lead generators typically receive financial incentives of 2-3% of the end-user price.
Group sales
Where possible, sales agents should bring together groups of potential customers in one location (e.g. for demonstrations). Aggregating potential sales can unlock some economies of scale on sales agents’ time and costs before expanding to new locations.
Support agents to increase penetration
Training, incentivising and supporting agents to return to a location a few weeks after selling to their first few customers helps to leverage word of mouth and attract the next wave of customers before competitors arrive.
Utilise client relationship management software
Investing in back-end infrastructure, such as client relationship management (CRM) software or a customer service team to identify and support lead generators, can bring additional sales through referrals or cross-selling.
Connect to the field
Ensure senior management spends time in the field each month so that they remain connected to the sales process and competitors. As a result, ideally, management should know where they stand on this benchmark value.
More last mile distribution KPIs and benchmarks
You can find more ways to measure the performance of your company in our Benchmarking KPIs for Last Mile Distributors publication. This resource contains explanations and benchmarks for 23 different KPIs, as well as guidance on best practice and additional resources.
In particular, you might find the following related KPIs from the publication useful:
KPI 1: Net Promoter Score
Satisfied or dissatisfied customers generate a positive or negative word of mouth that can impact local penetration.
KPI 8: Above-the-line marketing
Above-the-line marketing campaigns might help increase adoption at a national level over the short term, but they are unlikely to encourage group sales that deepen local penetration over time.
KPI 10: Revenue per sales agent
Agents grouping local sales are typically able to sell more in one go – thereby increasing the revenue per agent.
KPI 13: Sales agent churn
A long-standing agent can regularly go back to villages and increase penetration.
Additional resources
Below are more resources that will help you understand and improve your business performance:
- Creating Sustainable Last-Mile Distribution for Beneficial Products: Two Network Archetypes (and How They Can Scale Up), Hystra via NextBillion, 2021
- Marketing Innovative Devices for the BoP, Hystra, 2013
Sources
Main article
This content was adapted from KPI 9: Market penetration in Benchmarking KPIs for Last Mile Distributors, written by Hystra in partnership with the Global Distributors Collective.
Reference 1
Benchmark values are based on analysis by Hystra.
Top image
The black and white photo of a father and son has been adapted from an image by Freepik.
Funded by Transforming Energy Access
This material has been funded by UK aid from the UK government via the Transforming Energy Access platform; however, the views expressed do not necessarily reflect the UK government’s official policies.
