How to track and reduce your after-sales servicing costs

By Chitraksh Sharma, Lucie Bévierre & Lucie Klarsfeld McGrath at Hystra
Regularly measuring your product servicing rate provides a useful way to keep track of the number of servicing issues your company deals with as a proportion of the products you sell. As well as explaining how to calculate this metric, here we also provide best practice guidance on how to keep these costs low.
Responding to customers queries, dealing with product defects, and performing repairs under warranty all add to your costs. Tracking each of these individual after-sales costs can help your company understand where you need to make improvements.
Some changes may be more obvious than others. Poor quality products may have common defects or components that simply don’t last as long. Other times it may be that customers don’t know how to use the product properly or replace simple consumables like batteries or fuses
Product servicing rate KPI
The product servicing rate KPI measures the number of servicing issues your company deals with, compared to the number of products you sell. It is a good indicator of the quality of the products sold, how well sales agents have explained how to use the product, and how expensive it will be to provide after-sales service.
How to calculate product servicing rate

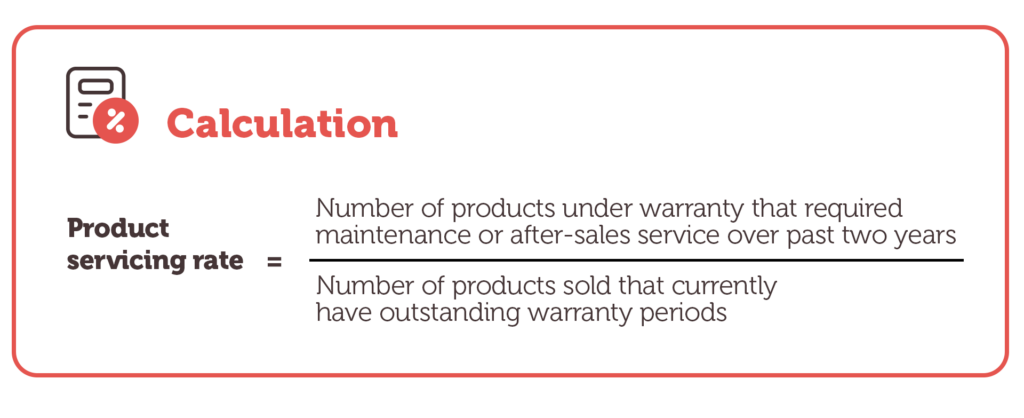
Use the following equation to calculate your product servicing rate:
Product servicing rate = Number of products under warranty that required maintenance or after-sales service over past two years ÷ Number of products sold that currently have outstanding warranty periods
Include any contact by a customer on any matter requiring customer support or after-sales service.
This KPI should be measured quarterly.
Caveats and clarifications
- Different product types will require different levels of after-sales service. Benchmark values need to be based on product type.
- This KPI focuses on identifying technical faults within the warranty period. 60 Decibels, an impact measurement organisation, uses a metric called the customer challenge rate to capture data on customers that have experienced a challenge. It covers four main categories: technical fault, mismatched expectations, misuse, and external factors. If you have access to 60 Decibels services, you may wish to use their metric in place of this KPI.
Benchmark values
- Can be improved: Not measured
- Best practice: Dependent on product type
Best practice
Track issue type
Develop a log to track the type and cause of issue reported by customers, such as:
- Product defect: Record the percentage of defective products so you can negotiate additional stocks with the manufacturer and ensure they resolve the defect.
- Improper usage: Consider developing training materials for sales agents to demonstrate to their customers how to use the product.
- Basic maintenance: Consider conducting customer group demonstrations on how to “self-repair” the most common issues.
Be proactive
For large or complex products which may require more customer support, ensure customers can use the product correctly from the start. Set up a proactive after-sales service to answer any further questions (e.g. include three after-sales support calls or visits in the price of the product; conduct calls proactively – don’t wait for your customers to declare an issue).
More last mile distribution KPIs and benchmarks
You can find more ways to measure the performance of your company in our Benchmarking KPIs for Last Mile Distributors publication. This resource contains explanations and benchmarks for 23 different KPIs, as well as guidance on best practice and additional resources.
In particular, you might find the following related KPIs from the publication useful:
KPI 1: Net Promoter Score
Generally, the more servicing a product needs, the less happy your customers will be.
KPI 16: Sales agent time efficiency
Training agents on how to explain to customers the use, functionality and maintenance of a product helps reduce the need for after-sales service.
Additional resources
Below is another resource that will help you improve your business performance:
- Why Off-grid Energy Matters 2024, p.38, 60 Decibels, 2024
Sources
Main article
This content was adapted from KPI 17: Product servicing rate in Benchmarking KPIs for Last Mile Distributors, written by Hystra in partnership with the Global Distributors Collective.
Top image
- The black and white photo of a man in a cap has been adapted from an image by Freepik.
Funded by Transforming Energy Access
This material has been funded by UK aid from the UK government via the Transforming Energy Access platform; however, the views expressed do not necessarily reflect the UK government’s official policies.
