How to minimise inventory losses

By Chitraksh Sharma, Lucie Bévierre & Lucie Klarsfeld McGrath at Hystra
In this short article on inventory management we introduce the stock loss KPI as way to track written-off goods. We also provide best practice guidance based on an analysis of last mile distributors, so you can see how your company compares to others in the sector.
Stock loss KPI
Stock can be written-off for a variety of reasons: damaged goods, theft, spoilage, poor warehousing, and obsolete products. Taking action to keep losses to a minimum is central to effective inventory management.
The stock loss KPI measures the value of written-off inventory as a proportion of the value of your total inventory.
The first step for many companies is to start tracking this KPI, and then to develop best practice processes that keep it as low as possible for your product type.
How to calculate stock loss

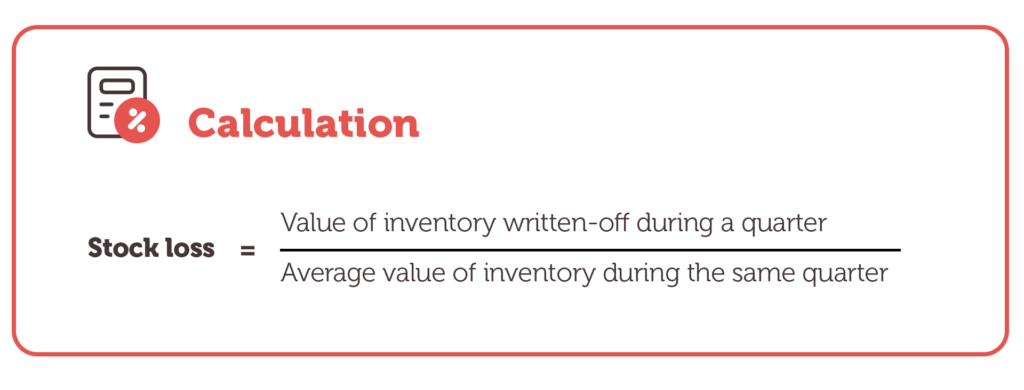
Use this equation to measure your stock loss:
Stock loss = Value of inventory written-off during a quarter ÷ Average value of inventory during the same quarter
This KPI should be measured quarterly.
The value of inventory written-off is the difference between the original cost of inventory and the amount which can be obtained by selling off or disposing of the inventory. If the inventory has no remaining value because it cannot be sold, the write off amount will be the full product cost.
Markdowns are price reductions on products that have not sold at their initial price. They may be necessary to ensure that inventory is sold and does not become obsolete.
All inventory values should be calculated at cost of goods sold.
Caveats and clarifications
Include write-offs due to the following reasons:
- Theft by shippers or employees
- Spoilage due to short shelf life
- Damage due to inadequate storage and handling
- Obsolete products (often for technology products with high market values that get replaced by next generation products)
Benchmark values
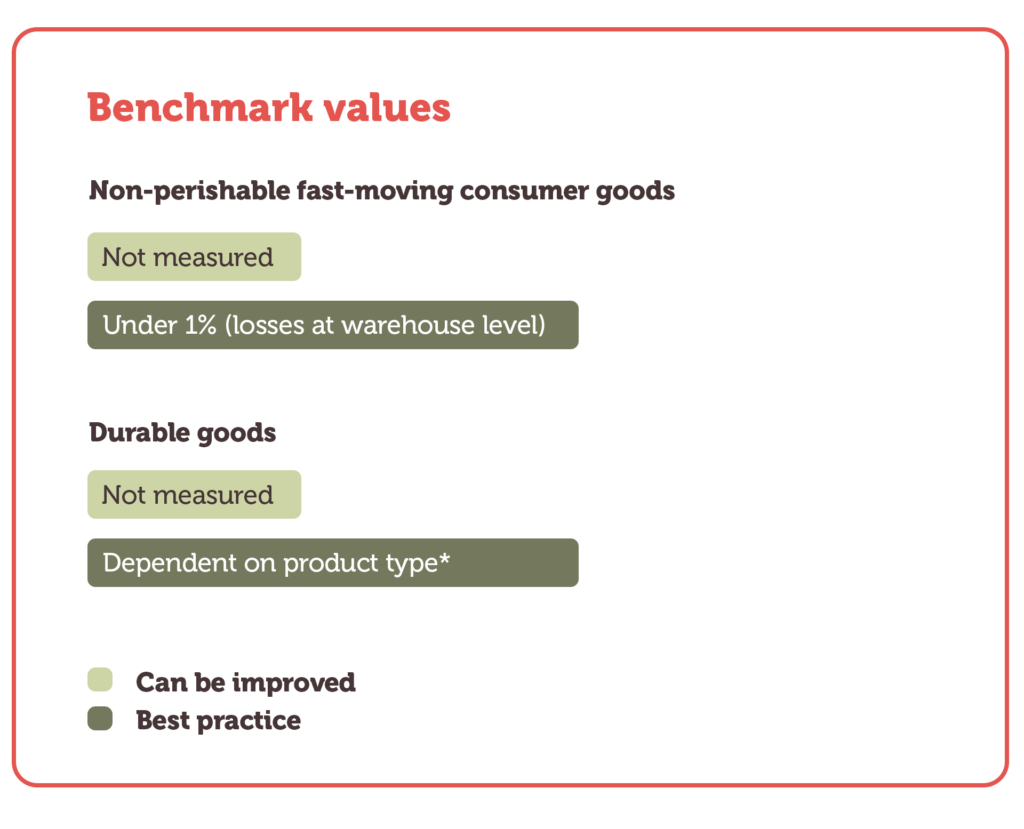
Benchmark values vary depending on product type:
Non-perishable fast-moving consumer goods
- Can be improved: Not measured
- Best practice: Under 1% (losses at warehouse level)
Durable goods
- Can be improved: Not measured
- Best practice: Dependent on product type*
*Very few companies selling durable goods are currently measuring this KPI, hence the lack of benchmark value.

Best practice
Monitor reasons for write-offs
Track the reasons for write-offs, including sales demand, markdown rates, improper storage and theft. You could consider phasing out certain products.
Use inventory management software
Use software tools to keep track of your inventory, including defects, write-offs and stock levels.
Check deliveries
Ensure proper checks of inventory upon delivery to identify defects or non-compliance early on.
Ensure appropriate storage
Measures to improve storage include keeping inventory across multiple sites, implementing dual control storage, using a bonded warehouse, ensuring physical sign-offs to release products, and organising storage to ensure a systematic ‘first in first out’ order of shipping for products stored in the warehouse.
Make workers aware of losses
Relevant workers should be aware of inventor write-offs and their causes. You can also tie incentives or bonuses to low stock loss rates.
More last mile distribution KPIs and benchmarks
You can find more ways to measure the performance of your company in our Benchmarking KPIs for Last Mile Distributors publication. This resource contains explanations and benchmarks for 23 different KPIs, as well as guidance on best practice and additional resources.
In particular, you might find the following related KPI from the publication useful:
KPI 20: Digitalisation indicator
Inventory procurement and agent inventory management are among the 15 key processes recommended to be digitalised.
Additional resources
Here is another resource that can help you understand and improve your inventory management:
- The importance of ABC analysis in inventory management, EasyStock, 2024
Sources
Main article
This content was adapted from KPI 18: Stock loss in Benchmarking KPIs for Last Mile Distributors, written by Hystra in partnership with the Global Distributors Collective.
Benchmark values
Benchmark values are the result of analysis by Hystra.
Top image
- The black and white photo of a woman has been adapted from an image by Drazen Zigic on Freepik.
- The conveyor belt graphic has been adapted from on image by upklyak on Freepik.
Funded by Transforming Energy Access
This material has been funded by UK aid from the UK government via the Transforming Energy Access platform; however, the views expressed do not necessarily reflect the UK government’s official policies.
