How last mile distributors can measure their inclusivity ratio

By Chitraksh Sharma, Lucie Bévierre & Lucie Klarsfeld McGrath at Hystra
In this article we explain how to use the inclusivity ratio KPI to measure how well your last mile distribution company is reaching women customers and people living below the poverty line. Plus we provide benchmark values that show the extent to which distributors in each sector serve the hardest to reach customers.
What is the inclusivity ratio?
Some customers may need a product but for various reasons they can’t access it. The product may not be sold where they live, or the price could be unaffordable. Last mile distributors with a high level of inclusivity aim to ensure that beneficial products and services are more widely affordable and available to people.
An inclusivity ratio tells you how inclusive your business is, based on a particular customer characteristic, such as income level or gender.
Targeting women or customers on lower incomes may require different sales and marketing strategies or service offerings. This KPI helps demonstrate the social impact of your business and is important to know when preparing to raise capital from impact investors.
How to calculate an inclusivity ratio

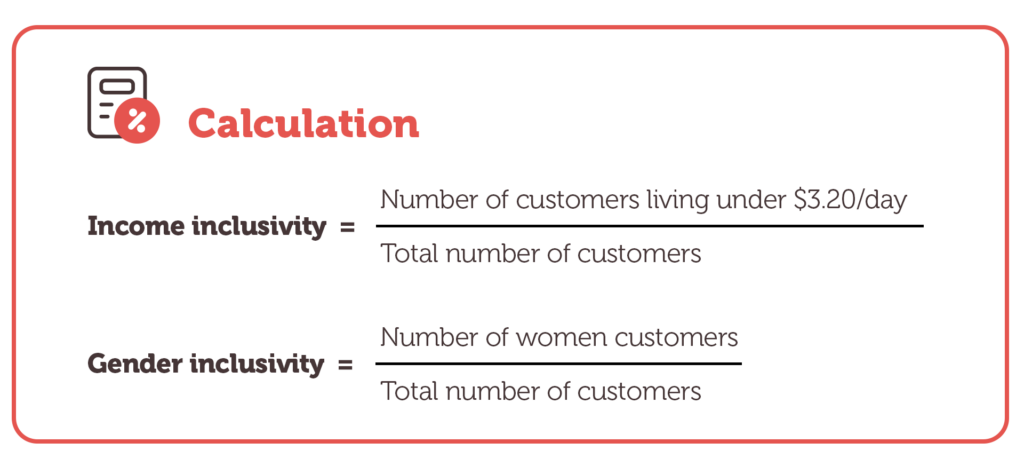
Use these two calculations to measure the inclusivity of your last mile distribution company:
Income inclusivity = Number of customers living under $3.20/day ÷ Total number of customers
Gender inclusivity = Number of women customers ÷ Total number of customers
This KPI should be measured yearly.
While here the measure of poverty is defined as $3.20/ day, you should adapt the poverty line to the countries and areas that you serve.
If you don’t know the income levels of your customers, look at other things that might give you an indication, such as where they live and the things they own or don’t own (e.g. a smartphone).
Caveats and clarifications
- This KPI is dependent on your company strategy and mission, geography, product type and industry.
- There is no good or bad inclusivity value as long as it aligns with your company strategy and activities.
- Inclusivity ratios may only be relevant for businesses with a social enterprise or impact-first business model, or in connection with impact fundraising.
Benchmark values
No set rules. See graphs below for benchmark data from the Global Distributors Collective and 60 Decibels.
Income inclusivity of last mile distributors
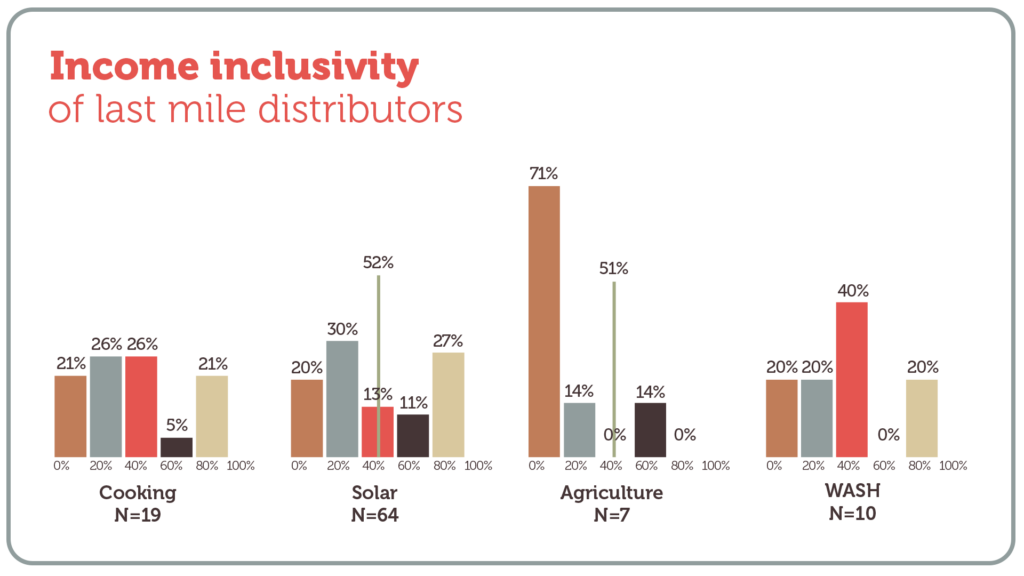
The graph below shows the extent to which last mile distributors serve customers living under $3.20/day. The vertical axis shows the percentage of last mile distributors surveyed. The horizontal axis shows the percentage of their customers living below the poverty line.

For example, in the WASH (water, sanitation and hygiene) sector we can see that 40% of last mile distributors surveyed have between 40% and 60% of their customers living under $3.20/day. The thin green vertical line shows the median for distributors surveyed in the solar and agriculture sectors. See below for data sources.
Gender inclusivity of last mile distributors
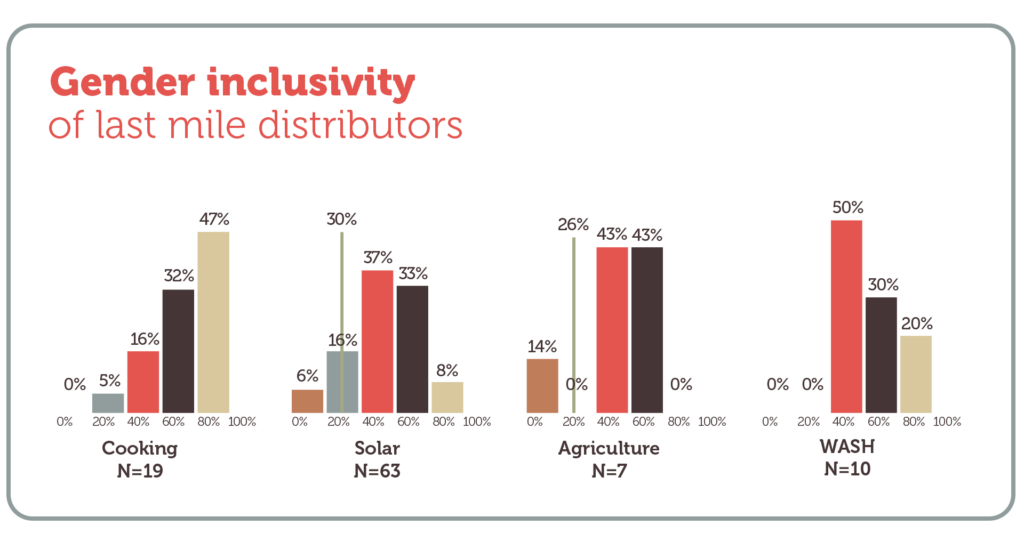
The graph below shows the extent to which last mile distributors serve women customers in each sector. The vertical axis shows the percentage of last mile distributors surveyed. The horizontal axis shows the percentage of their customers that are women.

For example, in the WASH sector we can see that 20% of last mile distributors surveyed have more than 80% women customers. The thin green vertical line shows the median of distributors surveyed in the solar and agriculture sectors. See below for data sources.
Best practice
Incentivise sales
One way to increase customer inclusivity is to incentivise sales agents to target these customers through higher commissions or bonuses. If you offer credit to customers, ensure credit assessment processes are followed.
Diversify customer base
Targeting only customers living below the poverty line may affect financial sustainability. To offset potential losses on this section of your portfolio, you may want to target other markets which are more profitable or leverage results-based financing programmes.
Deep dive into measures of poverty
If relevant, use tools like the poverty probability index (PPI) which helps organisations identify the customers who are most likely to be poor by integrating objective poverty data into their assessments and strategic decision-making.
More last mile distribution KPIs and benchmarks
You can find more ways to measure the performance of your company in our Benchmarking KPIs for Last Mile Distributors publication. This resource contains explanations and benchmarks for 23 different KPIs, as well as guidance on best practice and additional resources.
You might find it useful to look at KPI 3: Number of market segments, which is related to the inclusivity ratio KPI. Understanding the different pain points faced by lower income or female customers compared to higher income or male customers can help unlock new market opportunities.
Additional resources on inclusivity
Below are more resources that will help you understand and improve inclusivity:
- 60 Decibels Impact Performance Benchmarks, 60 Decibels, 2024
- LMD business diagnostic webinar, GDC, 2023
- Poverty Probability Index, IPA, 2023
- Supporting last-mile women energy entrepreneurs: What works and what does not, Energia, 2012
Sources
Main article
This content was adapted from KPI 6: Inclusivity ratio in Benchmarking KPIs for Last Mile Distributors, written by Hystra in partnership with the Global Distributors Collective.
Income and gender inclusivity data
- Global Distributors Collective member survey, 2021; data were cleaned for companies that had inconsistent answers
- 60 Decibels, 2024
Top image
- The black and white photo of the woman has been adapted from an image by freepik.
- The lightbulb illustration has been adapted from an image by studiogstock on Freepik.
Funded by Transforming Energy Access
This material has been funded by UK aid from the UK government via the Transforming Energy Access platform; however, the views expressed do not necessarily reflect the UK government’s official policies.
