Get feedback from last mile customers

By Chitraksh Sharma, Lucie Bévierre & Lucie Klarsfeld McGrath at Hystra
Regularly asking your customers what they think about your products and services lies at the heart of building a strong value proposition. Here we introduce a way to measure customer satisfaction that has been tried and tested by companies in a range sectors. We then provide a set of benchmark values specifically for last mile distributors, so you can see how your company is performing compared to your competitors.
Net Promoter Score®
Net Promoter Score (NPS®)1 is a globally recognised measure of customer satisfaction that is used across many industries. By gathering feedback from existing customers you can discover what people think about your products and services – and how loyal they are to your brand.
By calculating your NPS you can find out how likely your customers are to purchase from you again, and whether they would recommend you to others. Achieving high scores in this KPI suggests a strong connection between your customers and your company – and should help lower your acquisition costs.
How to calculate your Net Promoter Score

To calculate a Net Promoter Score you’ll need to survey some of your customers. Aim for at least 10% of your active customers base – the more you get, the more accurate your score.
This is the question you want to ask:
On a scale of 0 to 10, how likely are you to recommend [your product or service] to a friend or family member, where 0 is not at all likely, and 10 is extremely likely?
Once you’ve collected your responses, calculate the percentage of customers who rated their likelihood to recommend your product or service as 9 or 10. These customers are known as promoters.
Next calculate the percentage of customers who rated their likelihood to recommend your product or service as 6 or less. These customers are known as detractors.
To calculate your NPS, subtract your detractors from your promoters. This will result in a score between -100 and +100.
Net Promoter Score = ( Promoters (%) – Detractors (%) ) x 100
This KPI should be measured twice yearly.
Caveats and clarifications
- Scores vary across industries. 60 Decibels, an impact measurement company, have published median NPS benchmarks for different sectors, including agriculture (41), education (56) and off-grid energy (43).
- Scores vary across products. 60 Decibels found that in the off-grid energy sector, solar lanterns had a score of 64, while appliances scored 18.
- An NPS lower than 40 typically puts a company at risk because detractors or negative word of mouth may discourage new sales prospects.
- Research by Hystra has shown that a score higher than 60 is achievable, across different continents and sectors.
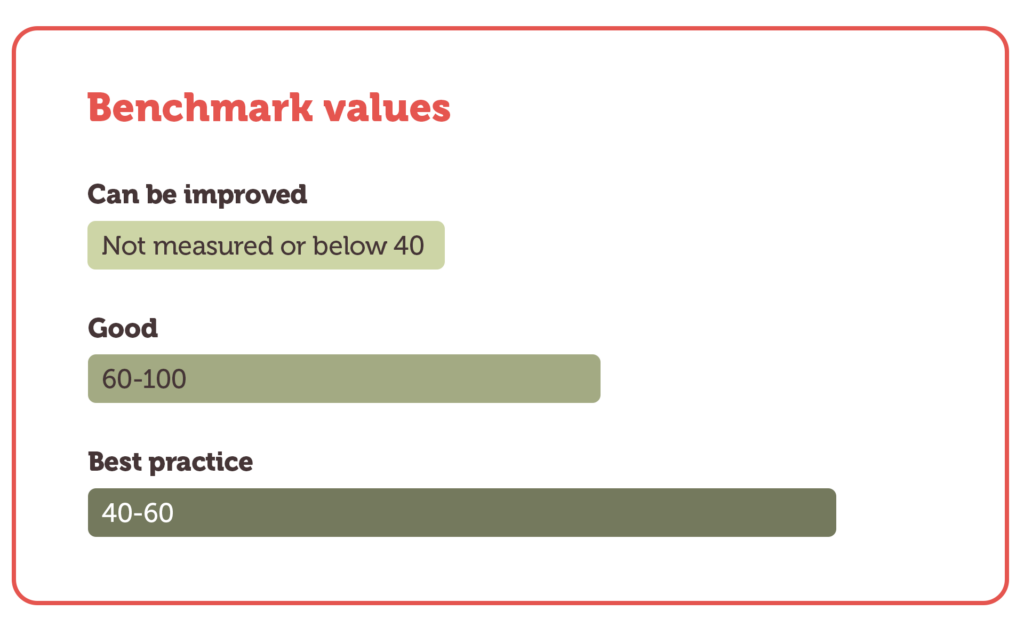
Benchmark values
- Can be improved: Not measured or below 40
- Good: 40-60
- Best practice: 60-100

Best practice
Track NPS for different products
To understand which of your products or services have the highest and lowest levels of customer satisfaction, create different surveys for each.
Track NPS for customer-facing staff
Ask customers how likely they would be to recommend customer-facing staff (e.g the salesperson who sold them the product; the technician who came to install it; etc). This will allow you to uncover early on any ill-adapted behaviours from your staff.
Go deeper
For more detailed responses, you could add an open-ended question to your survey asking customers to explain their answer. If a product or service gets a bad score, conduct further in-depth customer interviews to find out how to improve your offer.
Follow up with detractors
Immediately follow up with detractors to limit negative word of mouth and understand potential issues in your offering or customer service.
Align NPS with staff incentives
Tie customer-facing staff compensation to net promoter scores to encourage a great customer experience.
More last mile distribution KPIs and benchmarks
You can find more ways to measure the performance of your company in our Benchmarking KPIs for Last Mile Distributors publication. This resource contains explanations and benchmarks for 23 different KPIs, as well as guidance on best practice and additional resources.
In particular, you might find the following related KPIs from the publication useful:
KPI 2: Unique selling proposition
Customer pain points may be the reason some customers are dissatisfied and become detractors
KPI 7: Product utilisation rate
A satisfied customer is more likely to pay on time. Providing financing can increase your NPS, but customer over-indebtedness can reduce your score.
KPI 9: Market penetration
Satisfied or dissatisfied customers will affect your company brand and reputation in the market – and your ability to improve local penetration.
Additional resources
Below are more resources that will help you understand and improve your business performance:
- 60 Decibels Impact Performance Benchmarks, 60 Decibels, 2023
- Sistema.bio India increases their customer satisfaction by almost 40 percent, 60 Decibels, 2023
- Introducing the Net Promoter System, Bain & Company, 2011
- LMD business diagnostic webinar, GDC and Hystra, 2023
- Marketing Innovative Devices for the BoP, Hystra, 2013
- PAYGo PERFORM Technical Guide, CGAP, 2021
Sources
Main article
This content was adapted from KPI 1: Net Promoter Score in Benchmarking KPIs for Last Mile Distributors, written by Hystra in partnership with the Global Distributors Collective.
Reference 1
Net Promoter®, NPS®, NPS Prism®, and the NPS-related emoticons are registered trademarks of Bain & Company, Inc., NICE Systems, Inc., and Fred Reichheld. Net Promoter ScoreSM and Net Promoter SystemSM are service marks of Bain & Company, Inc., NICE Systems, Inc., and Fred Reichheld.
Top image
- The black and white photo of woman holding papers has been adapted from an image by Freepik.
Funded by Transforming Energy Access
This material has been funded by UK aid from the UK government via the Transforming Energy Access platform; however, the views expressed do not necessarily reflect the UK government’s official policies.
